|
District Data Profiles 2017 The Education Assessment and Accountability Review Subcommittee approved the Office of Education Accountability’s annual Kentucky District Data Profiles report in November 2017. The report provides a one-stop source of comprehensive district-level education data, including comparative data for all districts. The visualizations below serve as a supplement to the full report, which can be found at: https://apps.legislature.ky.gov/lrc/publications/ResearchReports/RR453.pdf. There are three separate visualizations:
The data in the visualizations are divided into five tabs:
2017 District Data Profiles The visualization below allows you to view the most recent data that are available. You can navigate to different parts of the report by using the tabs at the top. The profiles can be manipulated by selecting the districts, and the data can be sorted by clicking on the header titles. The data dictionary can be found in the full report. 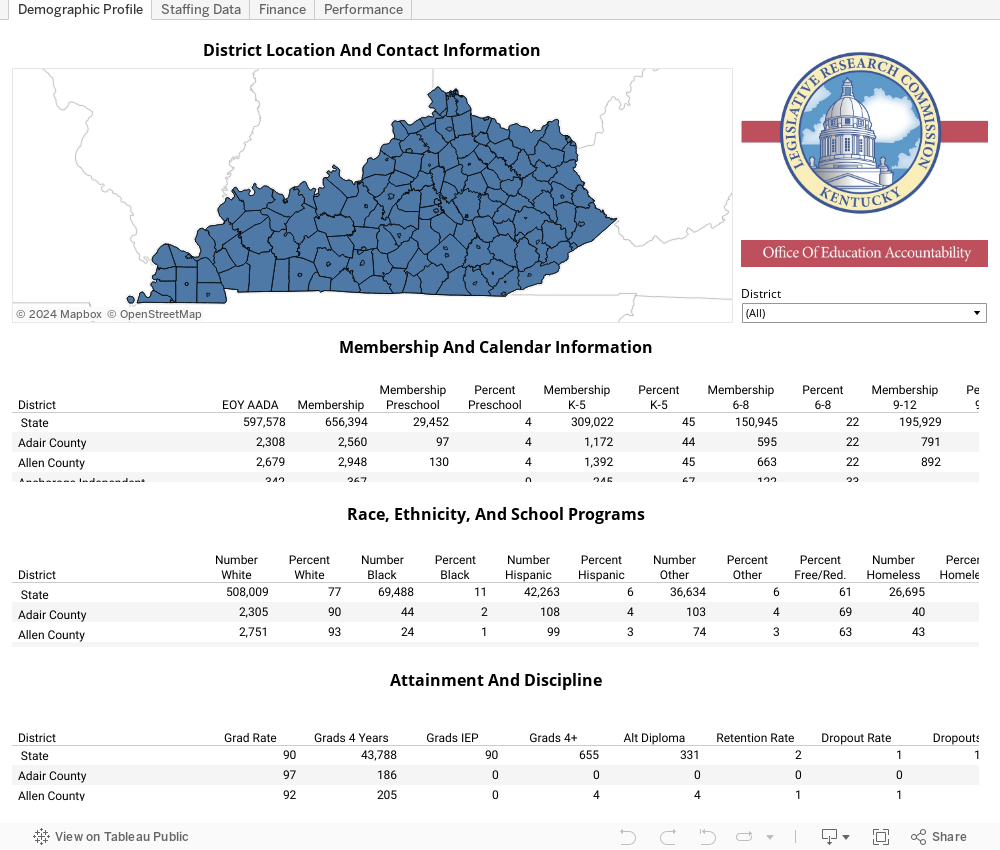 Note: Blank spaces indicate that the data are not available for that district. Some data may not be reported pursuant to the Family Educational Rights and Privacy Act, because there are no available data, or the data element is not applicable to that district. EOY AADA = end-of-year adjusted average daily attendance; LEP = limited English proficiency; IEP = individualized education program; FTE = full time equivalent; GF = general fund; BRAC = base realignment and closure; SEEK = Support Education Excellence in Kentucky; AP = Advanced Placement; CCR = college and career readiness. Source: Staff analysis of data from the Kentucky Department of Education and Open House Data. Heat Maps for Selected Variables, 2008-2017 This map shows data by district for the 2008-2017 school years. The map can be manipulated by selecting the academic year, districts, and desired measures. The data can be displayed by using your mouse to roll over the districts of interest. 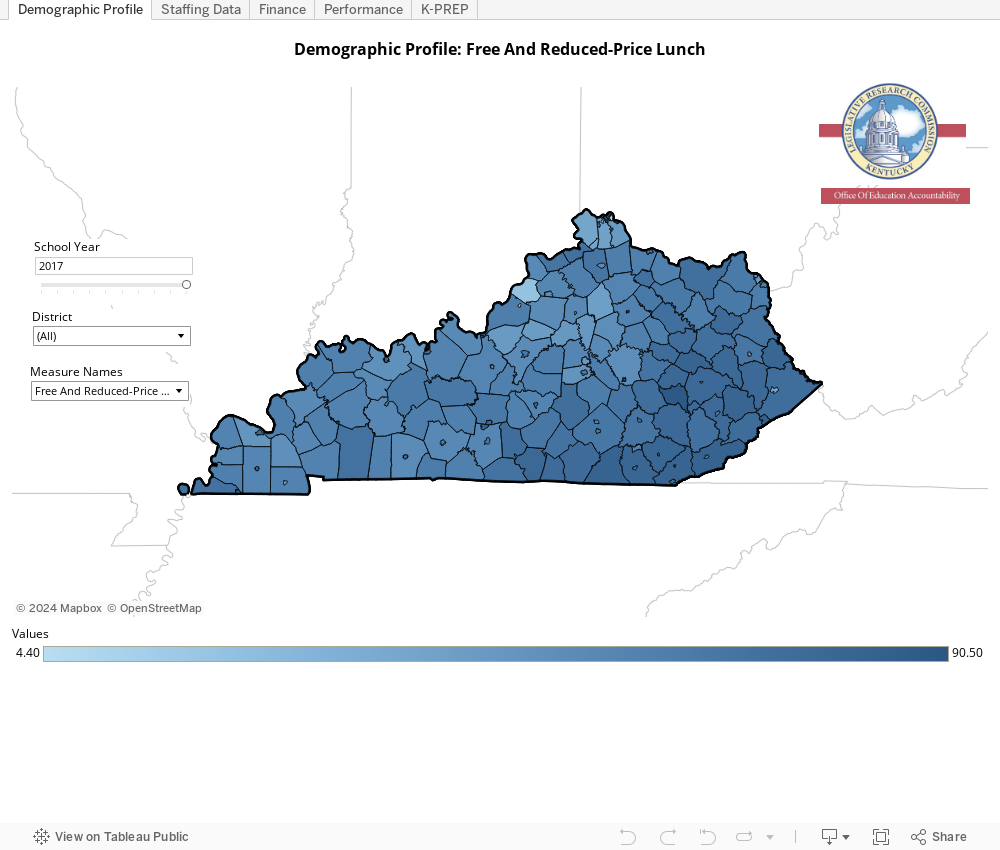 Note: Blank spaces indicate that the data are not available for that district. Some data may not be reported pursuant to the Family Educational Rights and Privacy Act or because there are no available data or the data element is not applicable to that district. LEP = limited English proficiency; GF = general fund; BRAC = base realignment and closure; SEEK = Support Education Excellence in Kentucky; AP = Advanced Placement; CCR = college and career readiness; K-PREP = Kentucky Performance Rating for Educational Progress. Source: Staff analysis of data from the Kentucky Department of Education and Open House Data. 10-Year Trends for Selected Variables, 2008-2017 This visualization shows trend lines by district for the 2008-2017 school years. The visualization can be manipulated by selecting the districts and desired measures. The data can be displayed by using your mouse to roll over the trend line of interest. 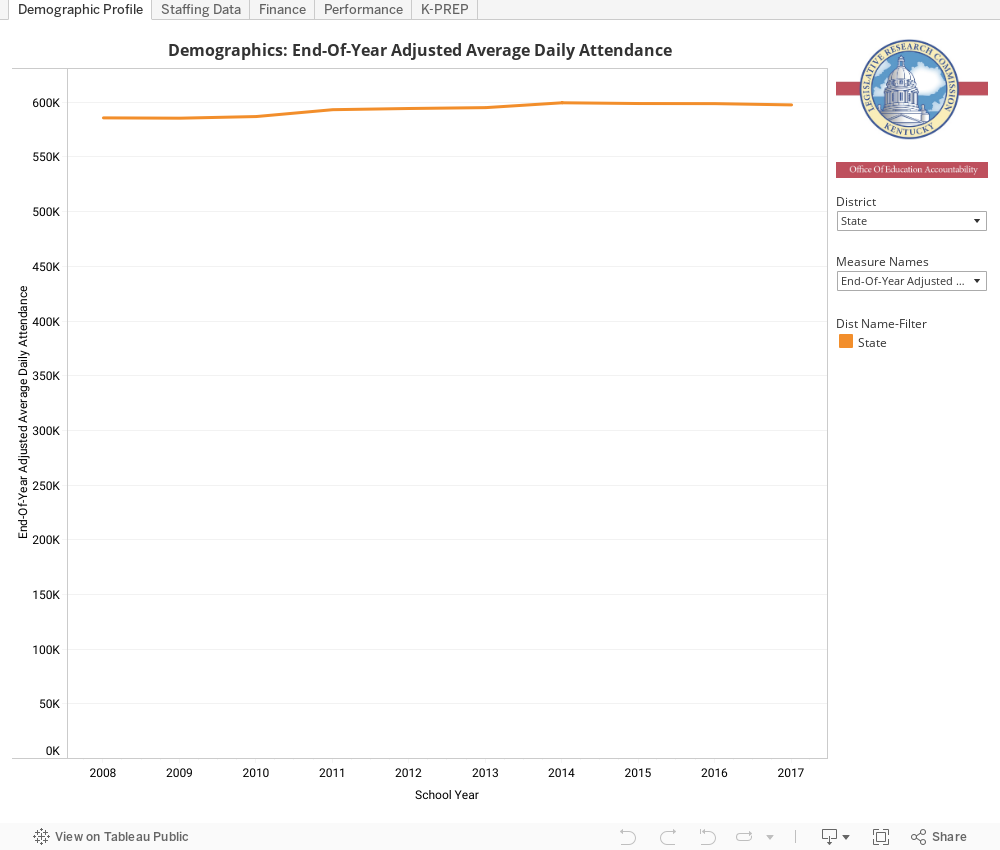 Note: Blank spaces indicate that the data are not available for that district. Some data may not be reported pursuant to the Family Educational Rights and Privacy Act, because there are no available data, or the data element is not applicable to that district. IEP = individualized education program; FTE = full time equivalent; SEEK = Support Education Excellence in Kentucky; AP = Advanced Placement; CCR = college and career readiness; K-PREP = Kentucky Performance Rating for Educational Progress. Source: Staff analysis of data from the Kentucky Department of Education and Open House Data. |