SEEK Funding By School District, 2020

The visualizations below serve as a supplement to the Full Report

This visualization shows the amount of state funding for the Support Education Excellence in Kentucky (SEEK) program by local school district in School Year 2020. The map can be adjusted by changing the SEEK guaranteed base, the multipliers for SEEK add ons, the required local effort, the equalization level, or the maximum tier I percent. The colors on the map display the extent to which changes in the SEEK formula would increase or decrease state funding in those districts. Below the map, the visualization displays the biggest and smallest changes in state funding per AADA by district for the selected changes to the SEEK formula. Below the map and to the left, the visualization displays the change required in the levied equivalent rate to maximize Tier I funding. Above the color gradient is the total change in state funding relative to the 2020 appropriation. Rolling over the districts displays an itemized summary of the changes to state funding in SEEK. By changing to the "District SEEK" tab and selecting a district, users can print out the itemized summary of changes to state funding in SEEK based on the changes that were made to the formula. The default map shows the funding as it was in the 2020 school year. To return to the defaults for the 2020 school year, click on the |🡠 button in the bottom task bar.

A Tutorial on How To Maximize The SEEK Visualization Tool


SEEK Visualization Tool


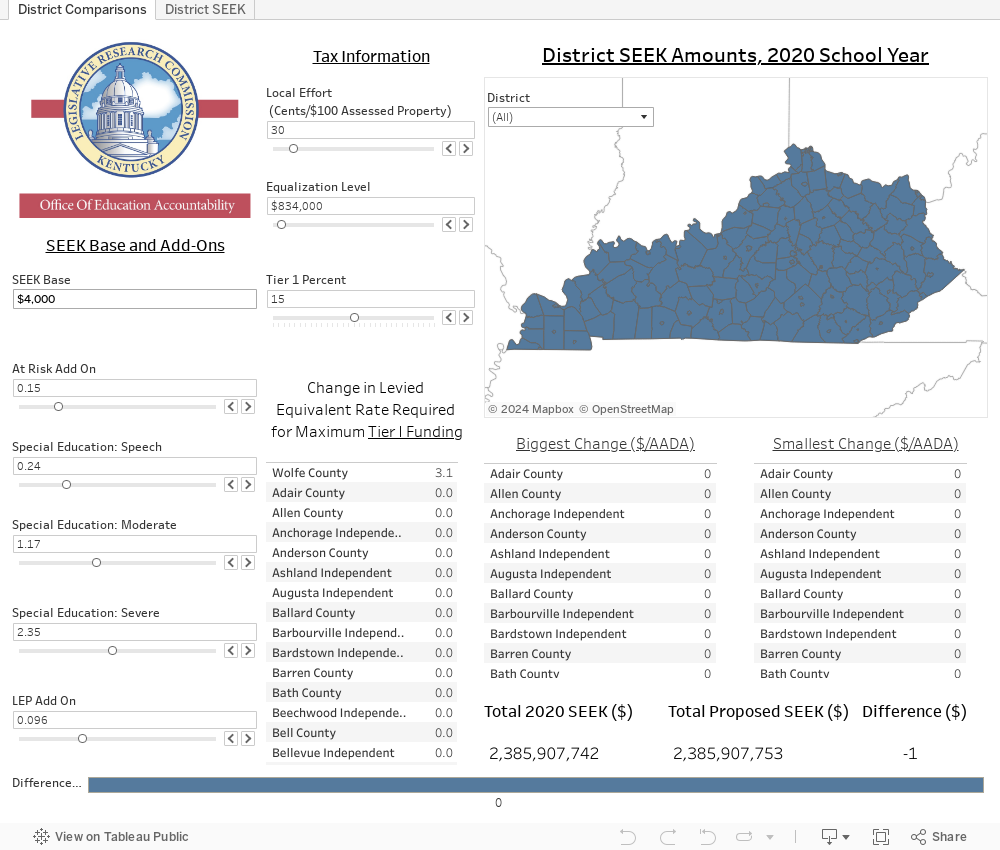
Note: SEEK = The Support Education Excellence in Kentucky funding program; AADA = adjusted average daily attendance; LEP = limited English proficiency. SEEK is the formula driven allocation of state provided funds to local school districts in Kentucky. The calculations only include the state portion of SEEK. The calculations do not include state equalization funding of nickels levied for school facilities. For School Year 2020, the SEEK guaranteed base was $4000, the at-risk add on was 0.15, the low incidence special education add on was 0.24, the moderate incidence special education add on was 1.17, the low incidence special education add on was 2.35, the limited English proficiency add on was 0.096, the guaranteed local effort was 30 cents per $100 assessed property value, the equalization level was $834,000 per pupil, and the maximum Tier I rate was 15 percent. Initial figure in "Difference ($)" does not sum due to rounding.
Source: Staff analysis of data from the Kentucky Department of Education.