The full report can be found at https://apps.legislature.ky.gov/lrc/publications/ResearchReports/RR449.pdf
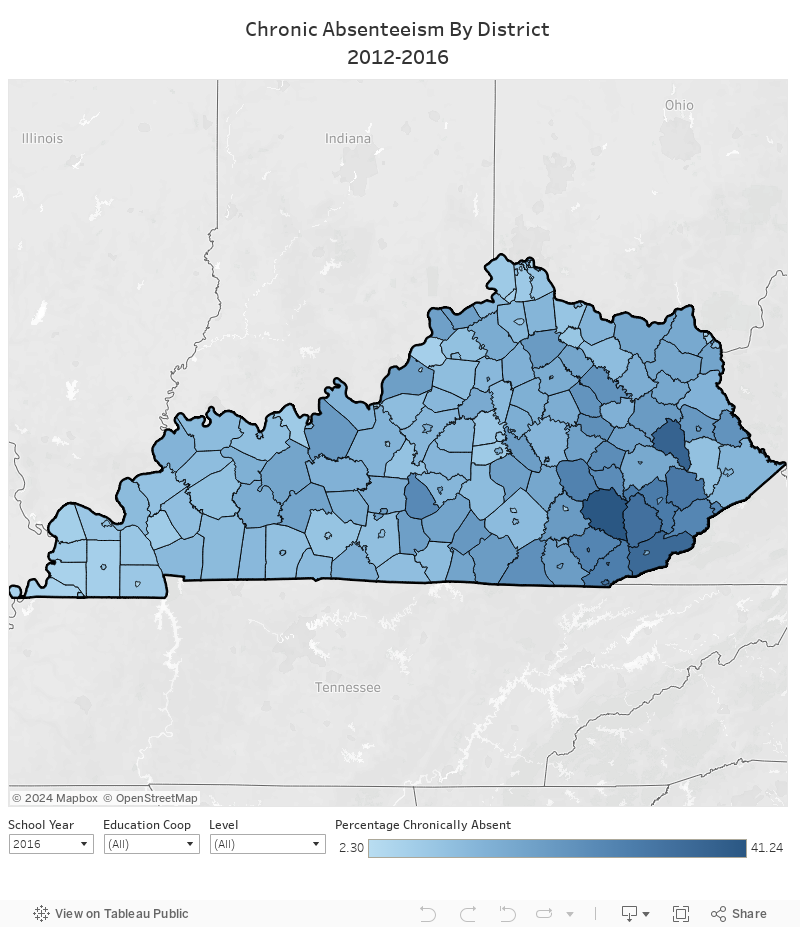
This map shows the chronic absenteeism rate by district for the 2012-2016 school years. School levels were determined using the grade of students. Those students in kindergarten through 5th grade were considered elementary, students in 6th-8th grade are middle school, and those in 9th-12th grade are labelled high school. The map can be manipulated by selecting the academic year, the educational cooperative, and school level.
Source: Staff analysis of data from the Kentucky Department of Education.
The full report can be found at https://apps.legislature.ky.gov/lrc/publications/ResearchReports/RR449.pdf
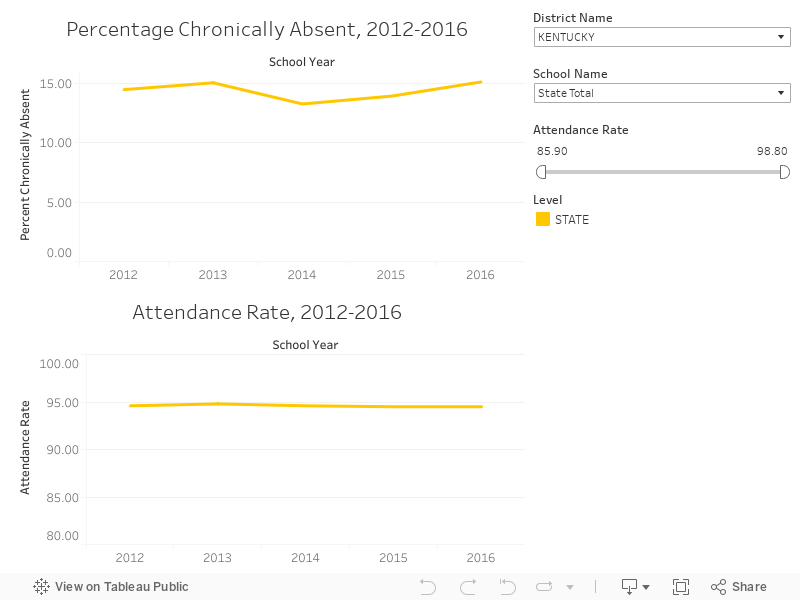
This figure shows the percentage of students chronically absent and the attendance rate for schools for the 2012-2016 school years. The top section is for the chronic absenteeism rate, and the bottom is the attendance rate. In both displays the yellow line indicates the state average, blue lines will indicate district averages, and the red lines will individual school averages. The visualizations can be filtered for district and schools.
Source: Staff analysis of data from the Kentucky Department of Education and Open House Data.